Usage
Overview
The Usage page lets you see how much FloTime and API usage you and your team has used over a chosen period.
Accessing Usage Settings
- Click your profile icon in the top-right corner
- Under TEAMS, select the team you want to manage
- Click Settings
- Select Usage from the settings menu
What you’ll see
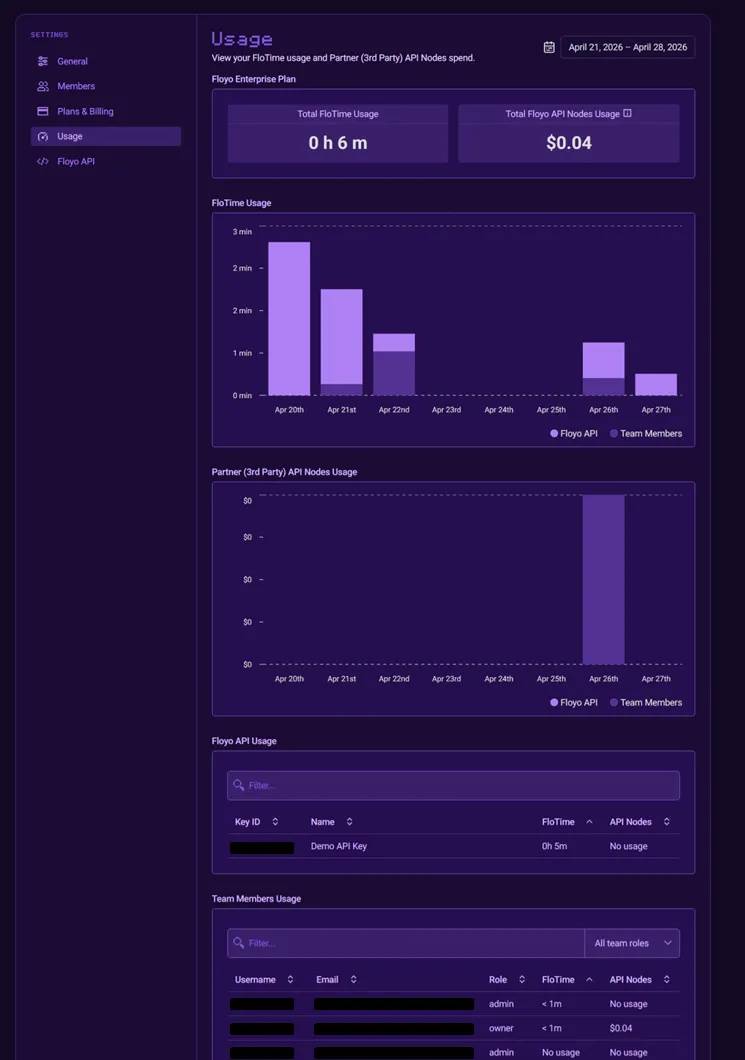
Date range By default the page shows the last 7 days. Use the date picker (top right) to choose a different range. The numbers and charts update automatically.
Summary at the top You’ll see total FloTime (in hours and minutes) and total API spend (in USD) for that period.
FloTime usage chart A bar chart of FloTime usage by day. Hover over a bar to see the total for that day and how much each Floyo API key or team member used.
Partner Nodes usage chart A bar chart of Partner Nodes spend by day. Hover over a bar to see the total cost for that day and each Floyo API key or team member’s share.
Floyo API usage table A table listing each Floyo API key with their total FloTime usage and total Partner Nodes spend for the selected period.
Team members usage table A table listing each team member with their total FloTime usage and total Partner Nodes spend for the selected period.
Detailed Run History
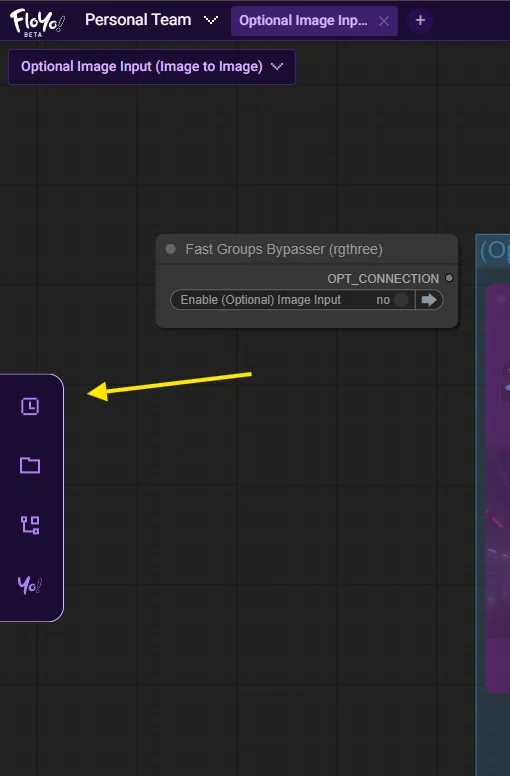
For itemized per-run usage, view the Run History inside the Floyo App:
- Click Launch App to open the canvas
- Click the Run History icon in the left sidebar
- Switch to the TEAM RUNS tab to see all team activity
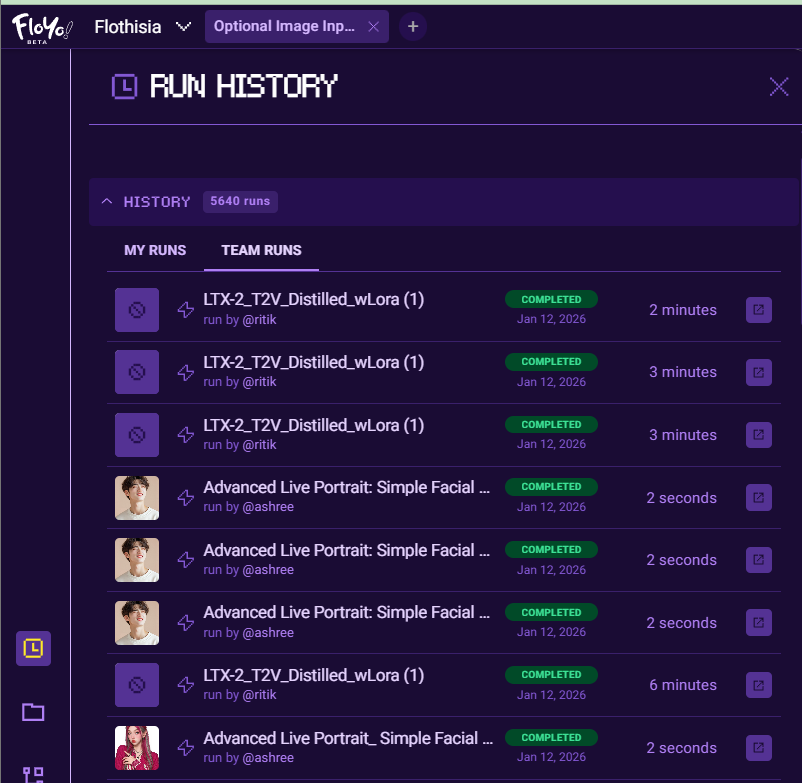
Each run shows:
- Workflow name
- User who ran it
- Status (Completed, Failed, etc.)
- Date and time
- Duration